Back to all posts

20 ways to enhance your table designs with practical functionlity

The ingredients of a successful data table user interface design.

Data is useless without the ability to visualize and act on it. The success of future industries will couple advanced data collection with a better user experience, and the data table comprises much of this user experience. 

Good data tables allow users to scan, analyze, compare, filter, sort, and manipulate information to derive insights and commit actions. This article presents a list of design structures, interaction patterns, and techniques to help you design better data tables.


Fixed Header

Scrolling fixed header table html css

Fixing the row header as a user scrolls provides context on what column the user is on.


Horizontal Scroll

Table horizontal scroll fixed left column html css

Horizontal scrolling is inevitable when presenting large datasets. It is good practice to place identifier data in the first column. As an advanced feature, enable individual locking of columns so users can compare data with multiple anchoring identifiers.


Resizable columns

Tables with resizable columns html css

Resizing columns allows users to see abbreviated data in full.


Row Style

Table row styles - stripes, lines, open

Zebra Stripes, Line Divisions, Free Form. The row style helps users scan data. Reducing visual noise by removing row lines or zebra stripes works well for small datasets. Users may lose their place when parsing larger datasets. Line divisions help users keep their place. Alternating rows (aka zebra stripes) help users keep their place when scanning long horizontal datasets. Although they cause usability problems when there is a small number of rows because users may ascribe meaning to the highlighted rows.


Display Density

Dynamically change the data density on a table - view switching

Smaller row height enables the user to view more data without the need for scrolling. However, is effects scannability leading to visual parsing errors. That is why many successful data table designs incorporate the ability to control display density.


Visual Table Summary

Summarise table data with visualisation, charts and graphs

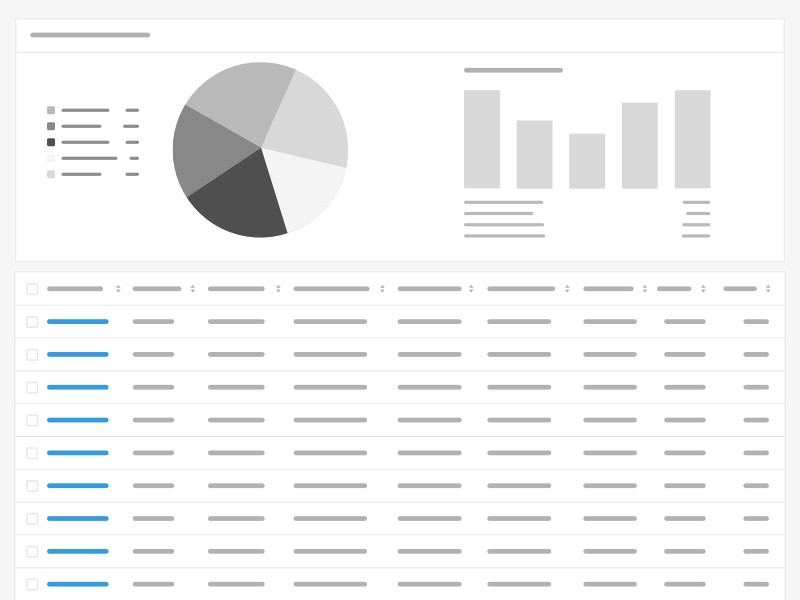
A visual data summary provides an overview of the accompanying table. It allows the user to spot patterns and issues in aggregate before actioning summary insights.


Pagination

Adding pagination to large tables of data

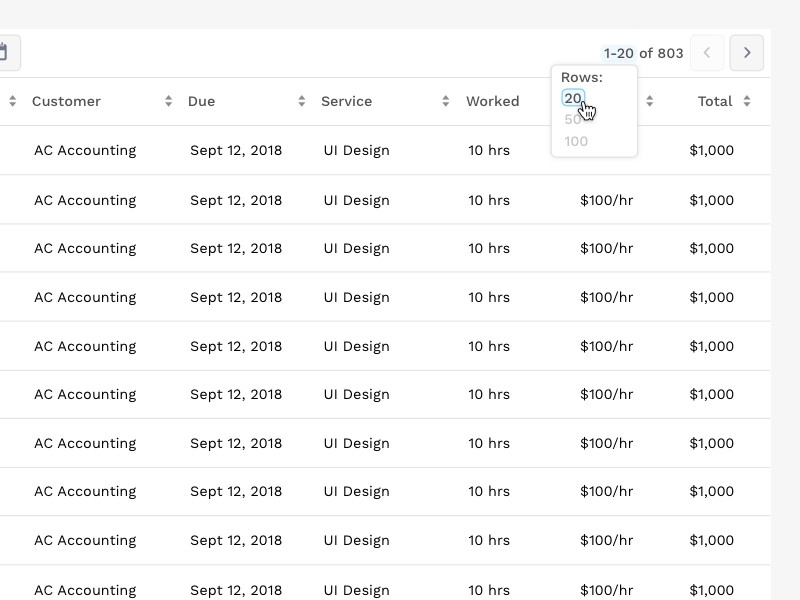
Pagination works by presenting a set number of rows in a view, with the ability to navigate to another set. The above example provides the ability to customize the row count per view. This pattern is often replaced by infinite scroll. Infinite scroll progressively loads results as a user scrolls. Infinite scroll works well for discovery websites, but is often disastrous for prioritization apps.


Hover Actions

Add table row actions on hover to reduce visual noise & repetition

Presenting additional action when a user hovers reduces visual clutter. However, it can cause discoverability issues because the user needs to interact with the table to expose the presentation of actions.


Inline Editing

inline editing of fields in a form

Inline editing allows the user to change data without navigating to a separate details view.


Expandable Rows

Accordion style expanding rows of data in table

Expandable rows allows the user to evaluate additional information without loosing their context.


Quick View

Use a dynamically appearing overlay panel to enable a quick view of data from a table row

Much like expandable rows, quick view enables a user to view additional information while staying in-context.


Modal

Use a model overlay window to show additional table data on interaction

Modals allow the user to stay within the table view, but provides more focus to the additional information and actions.


Multi-Modal

show additional table data with multiple overlays modals that can be opened and dragged around

A multi-modal feature is powerful for active use users to crank through a number of actions, or compare details of disparate items.


Row to Details

expand/collapse side panel inbox style to see more table details

Clicking on a row link transforms the table into a view with list items on the left and additional details on the right. It enables a user to parse large datasets, as well as reference many items without losing their place.


Sortable Columns

Always make columns that can be sorted, sortable

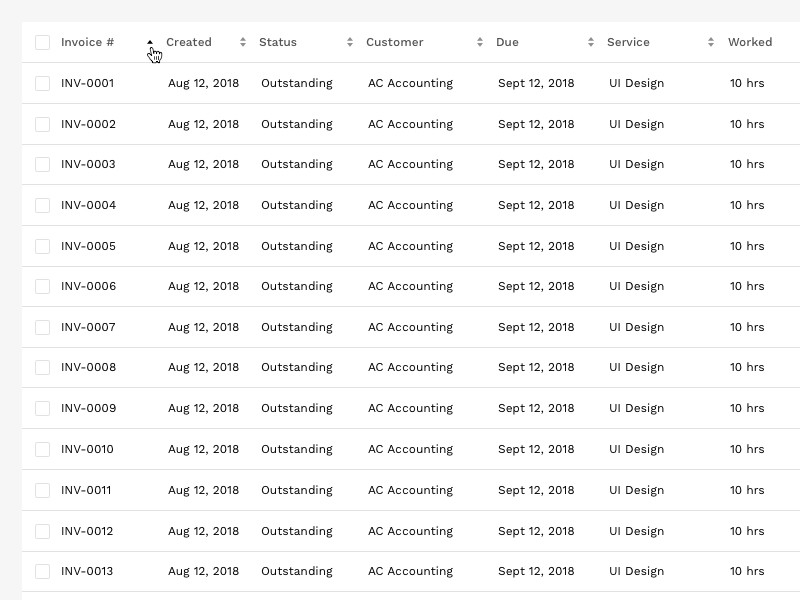
Column sorting allows users to organize rows alphabetically and numerically.


Basic Filtering

controls to filter the table data

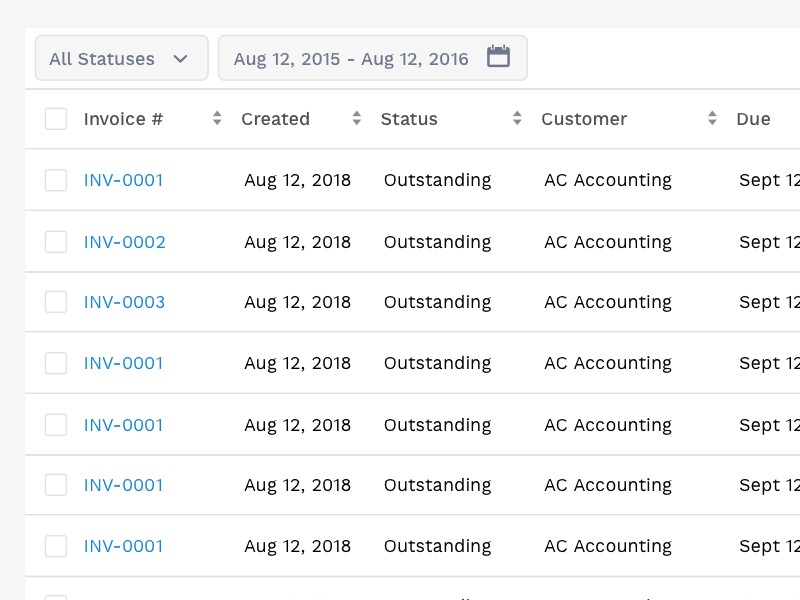
Basic filtering allows users to manipulate the data presented in the table.


Filter Columns

more detailed way to apply many filters across a table

This design pattern allows users to assign filtering parameters to specific columns.


Searchable Columns

Filter by text input search per column

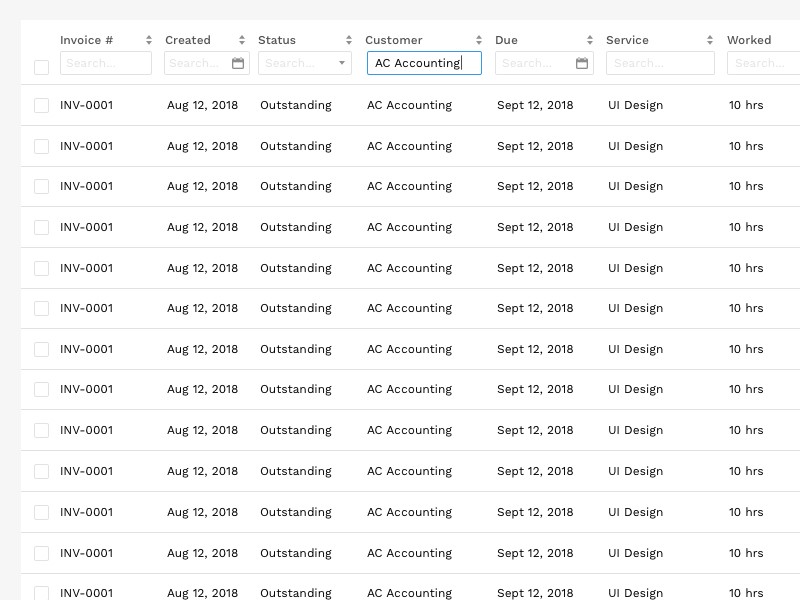
This design pattern allows a user to search specific values within each column.


Add Columns

Allow user to add a column to a table - customise

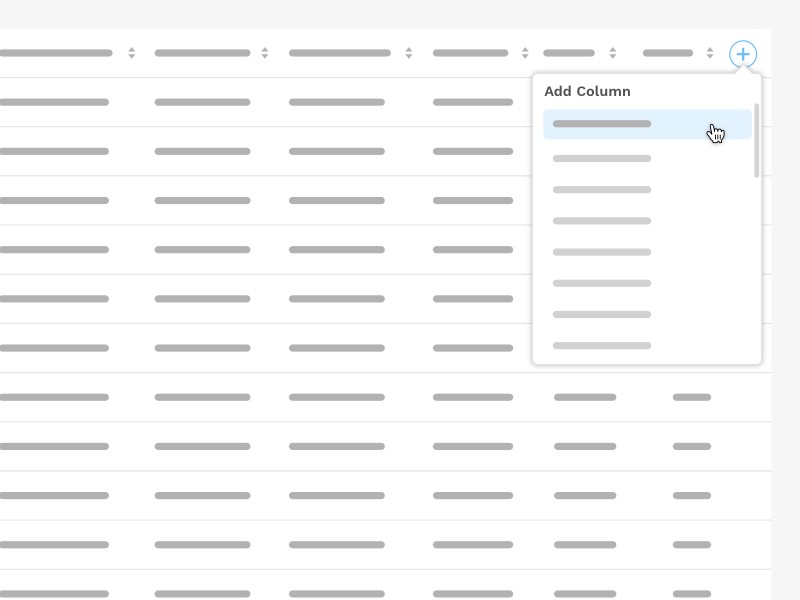
This pattern allows users to add columns from a dataset. It is a way to keep the table’s data limited to essential information, and allows the user to add additional columns based on their use case.


Customizable Columns

Add controls to allow users to turn on/off table columns to create a customised view

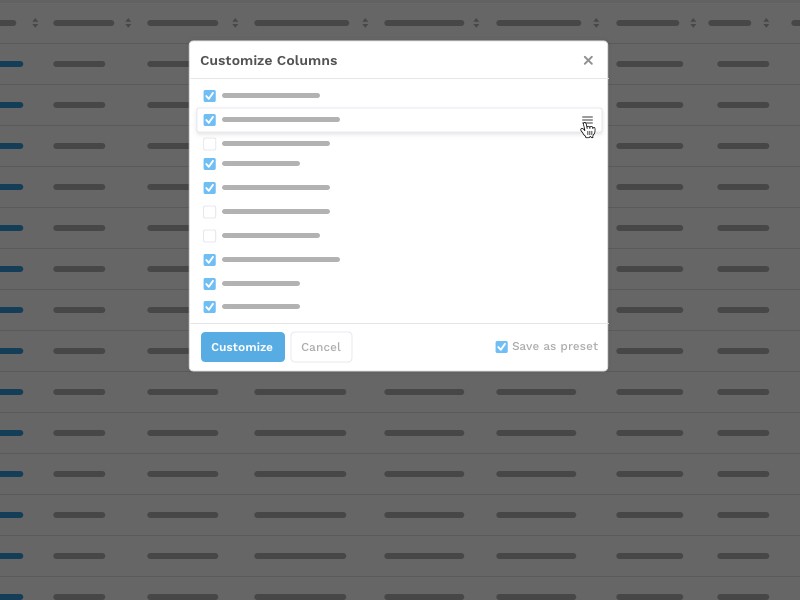
The customizable columns feature enables users to pick the columns they want to see and sort accordingly. The feature may include the ability to save presets for later use.


Why Tables Matter

Data is becoming the raw material of the global economy. The pursuit of data drives the reinvention of antiquated industries. Energy, media, manufacturing, logistics, healthcare, retail, finance, and even government are undergoing a digital transformation.

However, data is meaningless without the ability to visualize and act upon it. The companies that survive the next decade will not only have superior data, they will have a superior user experience.


Good user interface design is based on human goals and behavior. The user interface in-turn effects behavior, which further design decisions are based on. In subtle and unconscious ways, user experience alters how humans make decisions. What is seen, where it is presented, and how interactions are afforded, influence actions. It is important we make design decisions that lead to a better world, one data table design at a time.

This article was originally posted at:
https://uxdesign.cc/design-better-data-tables-4ecc99d23356

Can we take you from stuck to unstuck?

We'd love to hear from you

Product Design

The ‘Product’ is the website, service, application, interactive thing being worked on by the business. The practice of Product Design is similar in a lot of ways to UX Design. It involves the coming together of many specific design disciplines...

Call to action (CTA)

A call to action is a marketing term that refers to a prompt that invokes a response leading to a sale. When referring to a call to action (CTA) in the digital design world we usually mean the interactive element that leads to the next step in the experience - something that needs to be clicked or tapped.

User testing

User testing refers to a technique used in the design process to evaluate a product, feature or prototype with real users. There are several reasons why you might want to undergo usability testing, the most common is that it allows the design team to identify friction in a user experience they are designing, so that it can be addressed before being built or deployed.

WYSIWYG

WYSIWYG (pronounced WIZ-ee-wig) is an acronym for "What You See Is What You Get". It helps identify an an interface that allows user input resulting in an output that is rendered in a similar way. For example; a word processor application interface might resemble a piece of paper,so when printed the user can see how the output will appear.

Content Management System

A content management system (CMS) is an tool that allows a website editor/administrator to manage the content that is displayed. Websites are made of HTML and CSS to create pages. Pages can be hard-coded but would require technical development skills to make changes. A CMS usually allows a person without coding knowledge to amend existing and add new content to a website using a WYSIWYG interface.

Responsive Web Design

Responsive web design refers to a web page that dynamically adapts its layout to fit the size and orientation of the device on which it is viewed. A responsive design allows for a more optimised user experience across desktop and laptop computers as well as smartphones and tablets of varying sizes.

User Stories

User stories allow the functionality of a product or service to be expressed as written descriptions of an experience as seen from the users perspective. The writing of user stories creates a list of design and development tasks to complete in order to create any required functionality.

User Interface

A user interface (UI) is a conduit between human and computer interaction - the space where a user will interact with a computer or machine to complete tasks. The purpose of a UI is to enable a user to effectively control a computer or machine they are interacting with, and for feedback to be received in order to communicate effective completion of tasks.

Personas

A persona in UX Design is the characterisation of a user who represents a segment of your target audience. On a project you might create any number of personas to be representative of a range of user needs and desires. The solutions you design must answer these needs in order to deliver value to your target audience.

Card sorting

A great, reliable, inexpensive method for discovering patterns in how users would expect to find content or functionality. Card sorting is used to test the taxonomy of data with a group of subjects, usually to help inform the creation of the information architecture, user flow, or menu structure on a project.

Brainstorming

A technique used to generate ideas around a specific topic. Often done in groups, but can be done individuals. The process usually involves writing down all ideas around a topic onto paper, a whiteboard or stickies often implying some kind of association.

Minimum Viable Product

An MVP is a product that has the minimum set of features to prove the most essential hypothesis for a product. Businesses building a new product can create a Minimum Viable Product to prove that an idea is viable and warrants further investment. A further benefit being that the next stage of development can be informed by feedback obtained from testing that MVP.

Sitemap

A sitemap is a diagrammatic representation of a hierarchical system. It usually depicts the parent-sibling relationship between pages in a website, showing how sub pages might be arranged underneath their parent groupings. This arrangement forms a map of the site.

User journey

A user journey represents a sequence of events or experiences a user might encounter while using a product or service. A user journey can be mapped or designed to show the steps and choices presented as interactions, and the resulting actions.

Prototype

A prototype is draft representation built to test ideas for layout, behaviour and flow in a system. Prototypes are an indispensable tool for resolving a large number of potential issues in a concept or business before too many resources are deployed to put a design into production.

Wireframes

A Wireframe is a visual schematic that conveys a basic level of communication, structure and behaviour during the design of a system. Wireframes are low-fidelity designs that bypass including a detailed user interface or visual design, conveying just enough to get across the core idea.

Usability

To say something is usable is a qualitative statement about how easy that thing is to use. Usability is an assessment of how learnable a system is and how easy a user finds it to use. The usability of a system or product is a key factor in determining whether the user experience is a good one.

Information Architecture

Information architecture is the design and organisation of content, pages and data into a structure that aids users understanding of a system. A more organised system enables users to more easily find the information they require and complete the intended tasks.

UI Design

User Interface Design is the discipline of designing software interfaces for devices, ideally with a focus on maximising efficiency, responsiveness and aesthetics to foster a good user experience.

UX Design

The practice of User Experience (UX) Design is the coming together of many specific design related disciplines to improve the usability, responsiveness, uptake and aesthetics of a product or service.

User Experience

A general term that covers all aspects of a user's participation while engaging with something that has been designed. Usually when talking about User Experience in the digital design field it refers to the interactions, reactions, emotions and perceptions while using an app, service, website or product.